Series: AI × Supply Chain build breakdown, entry 01
Stack: Claude Code · Gmail MCP · Slack MCP · Google Sheets · Looker Studio
The problem
Dispatch issues, delivery problems and carrier complaints were landing across three different inboxes (kat@, hello@, sarah@). We knew there was a problem; we couldn’t put a number on it. No structure, no historical insight, no way of syncing each other’s work. Sarah would resolve a short-ship while I was on the road emailing a freight forwarder, while Doireann was chasing DPD on a missed pickup, and none of us would find out about each other’s threads until it came up in standup days later.
Three smart people doing the same triage in parallel. Information falling through gaps. Patterns invisible because nothing was being counted.
The goal
Get visibility into what’s happening across the three inboxes and summarise it for the team. Humans still own the response. The system makes the work visible and the data countable, and stops there.
What it does
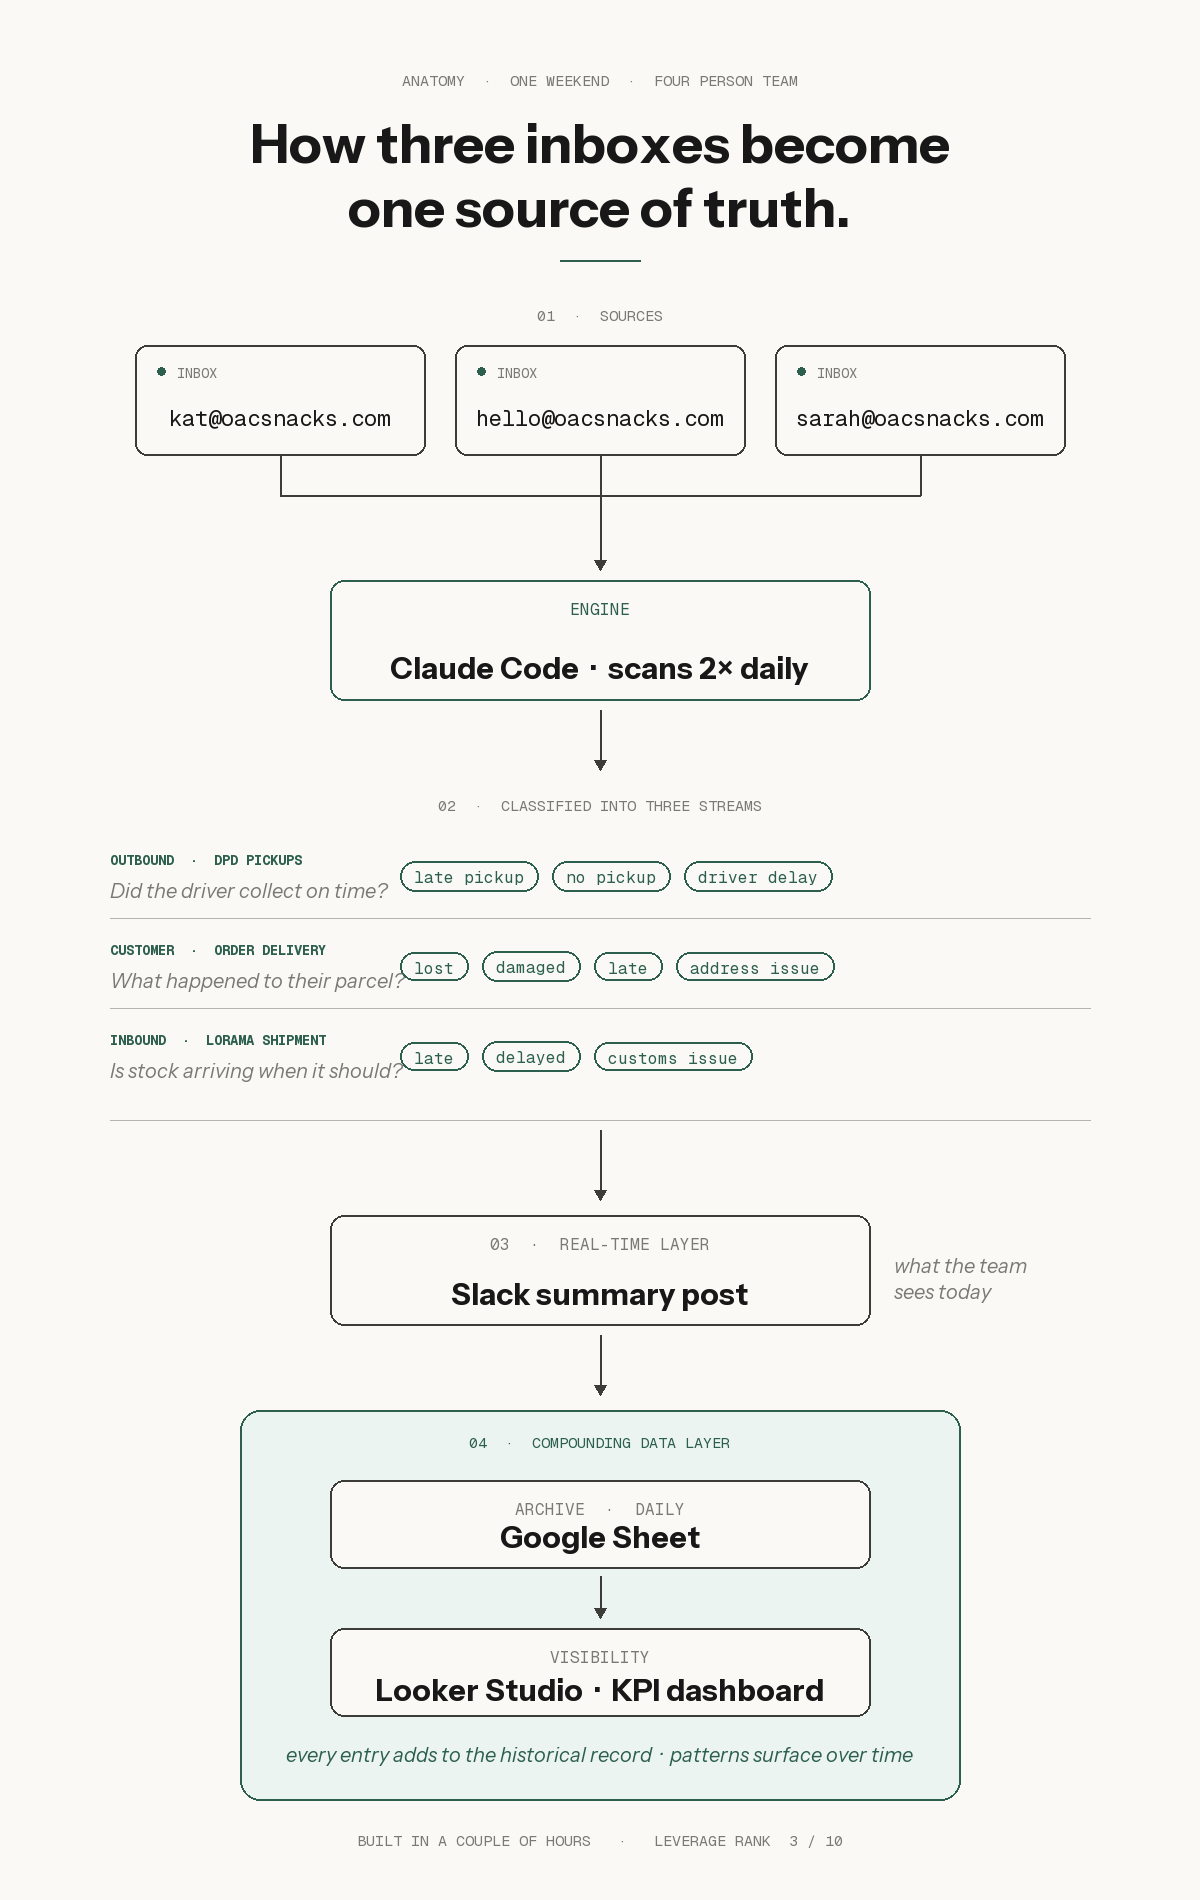
Twice a day, claude code scans the three inboxes, pulls anything that looks like a delivery or dispatch issue, classifies it into one of three streams, and posts a single summary into slack. Same structure every run. Daily, the data extracts into a google sheet (our “intelligence database”) which feeds a looker studio dashboard for a few quick KPIs.
The three streams
| Stream | Question it answers | Example tags |
|---|---|---|
| Outbound · DPD pickups | Did the driver collect on time? | late pickup, no pickup, driver delay |
| Customer · order delivery | What happened to their parcel? | lost, damaged, late, address issue |
| Inbound · co-manufacturer shipment | Is stock arriving when it should? | late, delayed, customs issue |
Lanes were a v2 decision. v1 had a single bucket and the noise was unmanageable: driver delays were getting tangled with customer parcel issues which were tangled with co-manufacturer inbound delays. They’re three different problems with three different owners, and the dashboard needed to reflect that.
A real Tuesday
One day this week, all three things happened:
- Sarah resolved a customer short-ship that had been flagged via shopify
- Doireann noticed DPD hadn’t done our outbound pickup at the normal time and emailed asking where the driver was
- I was on the road and sent a quick email to our freight forwarders asking the ETA on the inbound from our co-manufacturer
The next morning all three were categorised, dated, owner-tagged, and visible in slack. We could each see what the other two had been working on without anyone having to file a status update.
The build
Two layers, one engine.
Engine: A scheduled run of claude code with the gmail MCP and slack MCP connected. It scans each inbox over a fixed window (everything since the last run), filters for messages that match a set of delivery-related signals, classifies each into a stream + tags, and writes structured rows.
Real-time layer: A single slack summary post per run: what’s new, what’s been resolved, what’s outstanding. Replaces the “did you see…” slack DMs that used to fly around.
Compounding layer: Each run appends rows to a google sheet with full structured fields (date, owner, stream, tags, carrier, status, links). looker studio reads the sheet and renders a small dashboard with the things we actually care about: late pickups per week, lost parcels per month, inbound delay frequency.
The compounding layer is the part that pays off over time. The slack post is useful today; the sheet is what lets us answer “how many late pickups this month?” in three months.
What I’d do differently
- I’d skip the single-bucket v1. Should have shipped with the three lanes from day one. The time saved on v1 wasn’t worth the time spent re-classifying historical data when I rebuilt it.
- Build the dashboard at the same time as the database. I delayed looker for “later” and the data sat un-looked-at for two weeks. Visibility is the whole point: wire the dashboard up in the same session.
- Don’t filter at ingest. Early version filtered out anything that “didn’t look like a dispatch issue” before logging. We lost data. Now everything gets logged; filtering happens downstream where it can be re-run.
Build issues I ran into
- google workspace authorisation for inboxes I don’t own. Took 4 tries to find the right OAuth path to give claude read access to hello@ and sarah@ from a domain-wide perspective. The answer was domain-level admin consent.
- Classification was iterative. The first prompt version over-flagged anything mentioning “delivery”, including marketing emails about deliveries. Multiple iterations to tune the signal-to-noise.
- State-across-runs was hard. Email threads resolve over days. I had to build logic for “this thread already exists in the database: update its status, don’t insert a duplicate.” Solved by hashing thread IDs and doing an upsert.
What we’re not using it for
- Resolving customer issues
- Drafting replies for customers
- Making decisions on our behalf
Customers always come first at oac, and customer trust is built by humans replying to humans. The system makes the work visible. Humans still own the response.
Cost
- Build time: ~2 hours over a Saturday morning
- Ongoing token cost: trivial. Runs happen twice a day, each is a focused scan
- Maintenance: zero so far (3 weeks in)
Leverage rating: 3 / 10
A small automation. Small fix.
But syncing multi-team work into one source of truth (tracking, visibility, generating data out of these touchpoints) is something both small and large companies struggle with. We can finally count. “How many late pickups this month?” used to be a hunch. Now it’s a factual number, and patterns are starting to surface.
The leverage will grow as the dataset grows. In six months this sheet will be the single most useful artefact for renegotiating our carrier contract.
This is build entry 01 in an ongoing series. The script and prompts are forkable. Email me if you want them. Related: the Shopify Ops Starter is the productised version of this kind of data plumbing.