Series: AI × Supply Chain build breakdown
Stack: Claude Code · Python + GitHub · one overworked Google Sheet
This whole entry is free to lift: copy and paste it into your own AI and ask it to build the same thing for your company.
The setup
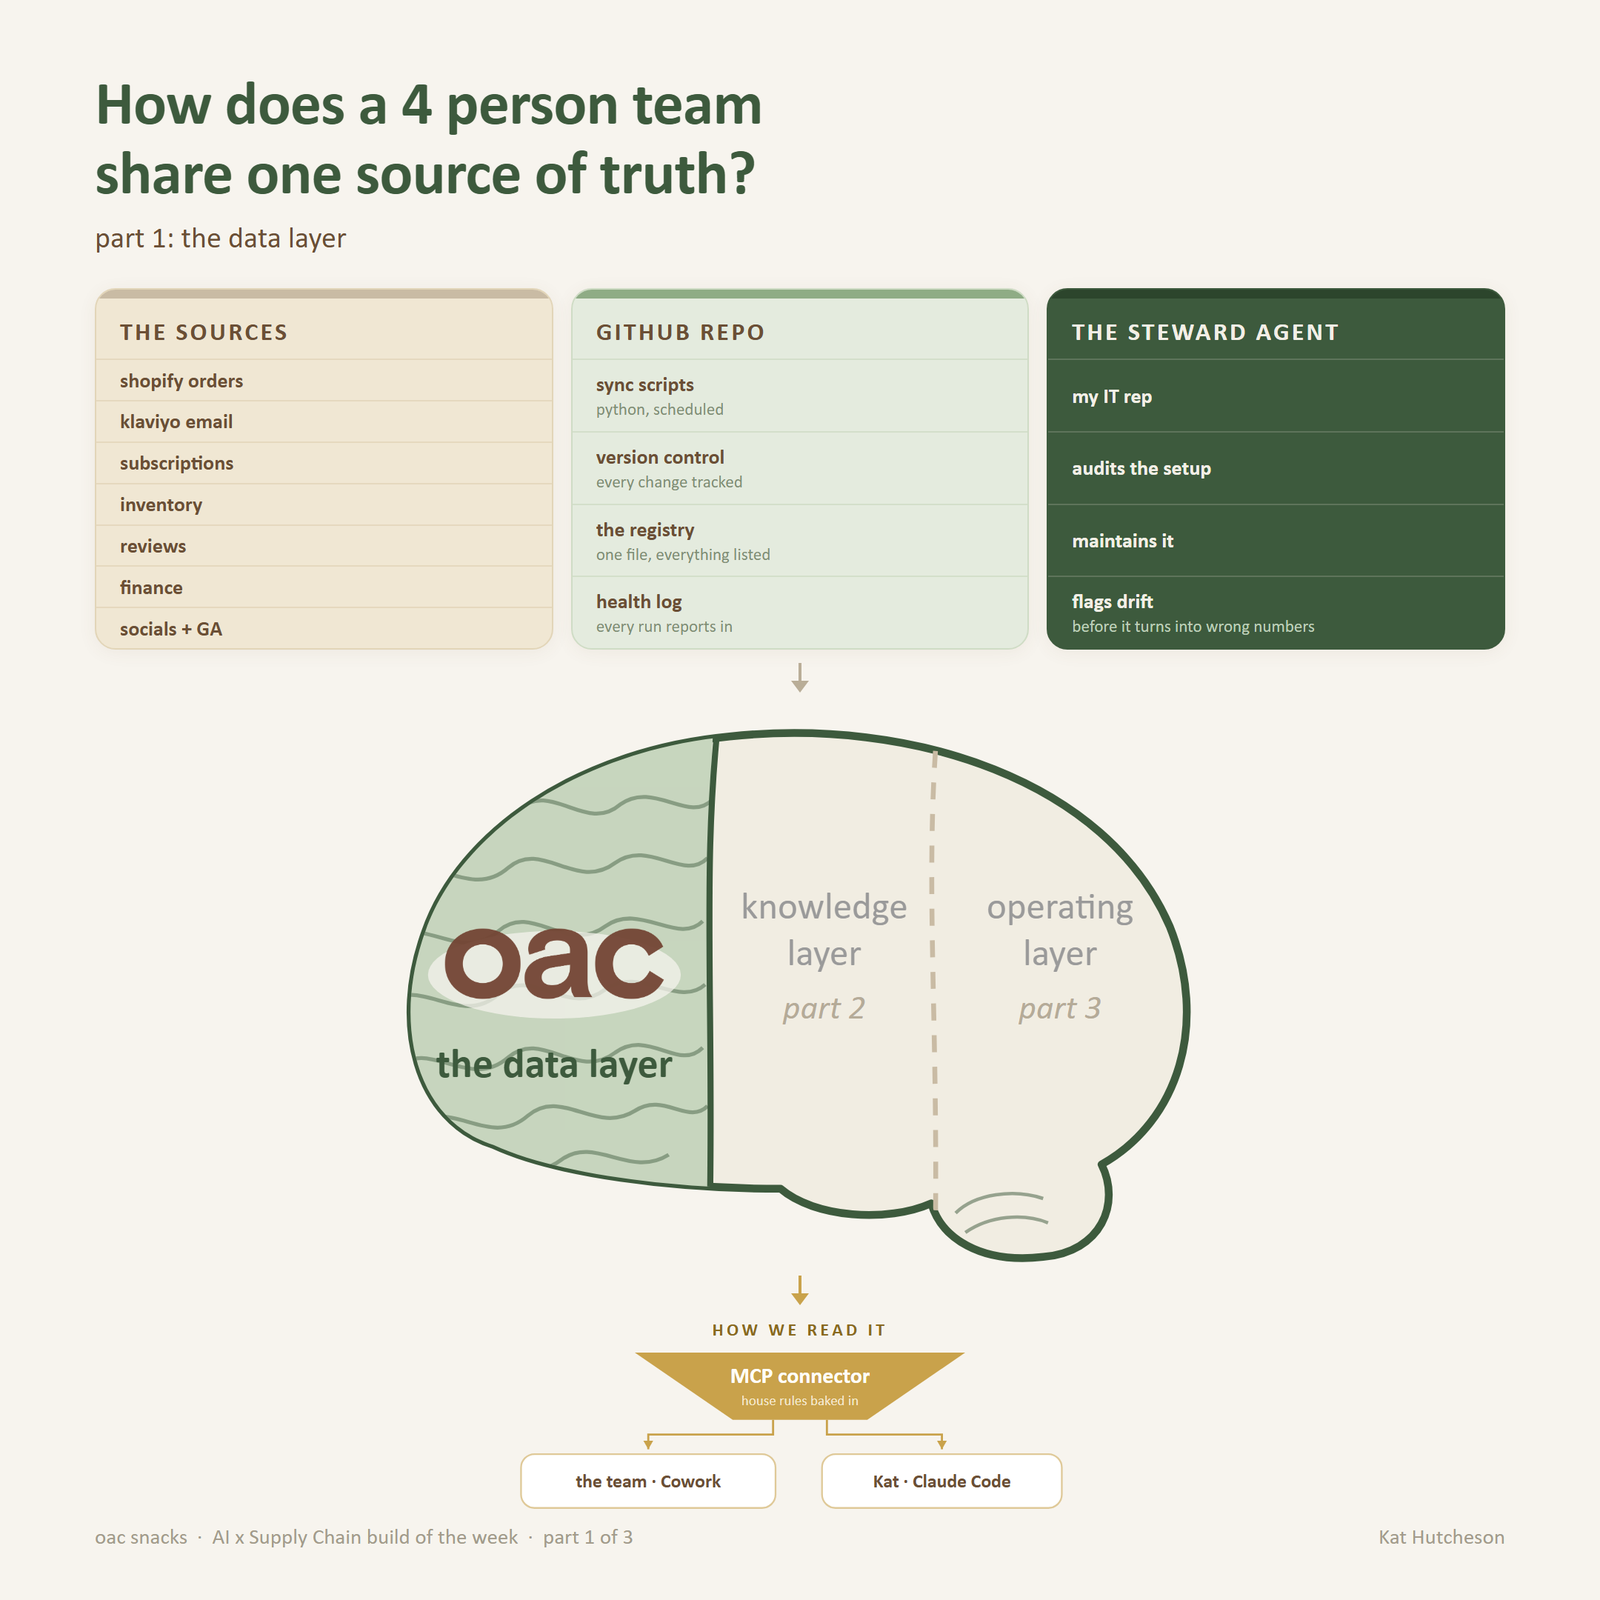
oac’s brain has a few parts: the data layer, the knowledge layer (SOPs, definitions, context docs), and the operating layer (the agents that keep it all clean). The detail today is an overview of the data layer. It’s a blend of needing the correct data, governance to keep it clean and clear, and the ability for the whole team to tap into it.
- One Google Sheet workbook as the single source of truth (developers, I know this isn’t future proof)
- Python scripts sync each source on a schedule and log a health check every run
- All of it version controlled on GitHub
- Naming conventions and a “how to use it” doc so each person’s AI can navigate it
- A steward agent (Dwight) that acts as my IT rep, auditing and maintaining the infrastructure with me
How it’s actually wired
The workbook is 60+ tabs:
- Two levels for orders. One tab holds the sales level (one row per order line: revenue, discounts, AOV analysis). A second holds the unit blow down level (one row per order, line item and flavour, with bundles exploded into their component units). Sales questions hit the first, demand and inventory questions hit the second. Different levels for different analysis and use cases.
- Every sync logs its own health. Each script writes a row to a health log tab on every run: source, timestamp, rows written, success or failure. A freshness tab computes FRESH or STALE per source against its expected cadence.
- A README tab as a coverage index. Every tab is tagged LIVE, STALE, ROADMAP or REFERENCE, with the known gotchas collected in one place. New AI session, same map.
- Context tables. A promotions log and a product lifecycle tab, so anomalies get read with context: the dip last August was a production gap, not churn.
Getting at the data
Tapping into the sources was the hardest part. Every app wants you to pay more for API access, so I got creative:
- Shopify: built a custom app on the Admin API and ditched the standard MCP connector (it only sees 60 days of order history; the custom app sees all of it). The auth process with shopify required customer support and took longer than the sync script.
- Klaviyo: decent API, but it caps every pull at one year and paginates slowly. Backfills run in chunks; the events pull is the slowest one. But it’s usable.
- Subscriptions: a workaround until we pay for the API. The logic is built on Shopify order tags. It doesn’t give us all the necessary information, but it’s good for now.
- Inventory: comes through Shopify, built on our material manager setup.
- Finance: CSV exports on a rhythm, because the Xero API costs more.
- Metricool + Google Analytics: connected, still working out the best way to use the data.
The rules that keep the numbers honest
What matters most and parts I would skip:
- Metric definitions are locked in one tab. What counts as revenue, what a subscriber is, what gets excluded. Every tool computes from the same definitions, so two people asking the same question get the same number.
- Classification is computed once, in the pipeline. Whether an order is B2B or DTC, whether a line is a free sample: these live as columns written by the sync, not logic each person’s AI re-derives at question time. Tag once, slice many ways.
- Nothing is filtered when taking in the data. Every order line lands in the workbook, samples and tests included. Filtering happens downstream, per question, so no analysis silently drops data another analysis needed.
- A steward agent enforces all of it. Dwight is an agent whose whole job is governance: he runs on a schedule, checks that every tab is registered, fresh and documented, that scripts and their schedules match the registry, and that nothing has drifted since the last audit. He proposes fixes rather than making them for now, he’ll eventually graduate to be more autonomous when I trust his decision making.
What failed first (so you can skip it)
- Letting AI read the sheet through the Google Drive connector via Cowork. Big tabs get silently truncated. The answer comes back looking right and it is wrong. The fix became the whole architecture: a server that reads the sheet server-side and returns scoped answers. This was a roadblock for our team since I’m the only one in Claude code.
- Trusting tags to classify our data. Our tags were polluted: the same tag covering wholesale accounts, influencer gifting, press samples and staff orders. The fix was definitions and context tables, with classification computed in the pipeline instead of inferred from tags.
- Running sync schedules on my laptop. The task fires when the laptop wakes, crashes half the time, and skips the days the laptop is off. Everything moved to cloud schedules (GitHub Actions) so nothing depends on my machine being open.
Where it landed
All of it led to one decision: an MCP connector is how the team reaches the brain. I’m on Claude Code, the team is on Cowork, so I’m building a custom MCP server (a small cloud service, token authenticated) they add as a connector. It exposes the brain as tools, not a raw file: named queries with the house rules baked in, a freshness warning attached to every answer, and a couple of carefully whitelisted writes (like stamping a doc as verified). Everyone pulls the right data, summarized and visual, into whatever they’re working on.
Where to start (if you’re building your own)
The build order I’d give another operator looking to build this for your business:
1. Map your data sources. One table, before you write anything: every system that holds a number you rely on, what it holds, how you can get data out (API, CSV export, app report), what that access costs, and how far back it goes. The gotchas live here. Our standard Shopify connector only saw 60 days, Klaviyo caps pulls at one year, the finance API was paywalled. You want to discover that on paper, not three weeks into a build.
2. Specify who gets access, and to what. Reads and writes are different decisions. Ours: the team reads through scoped tools (never the raw workbook), all writes go through scripts or a short whitelist, and one person owns the definitions.
3. Take security seriously before anything is shared. The workbook holds financials and customer data, so: a least-privilege service account for anything automated, secrets in files and never in code (and never pasted into an AI chat), token auth on the connector, and guards on any tool that could dump a tab full of names and emails. Decide what is team-visible and flag the rest.
4. Write down the questions you consistently want answered. Before the schema. Ours came from a team workshop: everyone ranked the metrics they actually check and the questions they keep asking. That list decided which sources got wired first and which tabs exist at all. The goal is not to have a bunch of data to then interpret, we want the interpretations turned into insights and actions from the get go.
Leverage rating: 6 / 10
The brain is the compounding asset, the data ensures it has one source of truth.
Part 2 upcoming: the knowledge layer.
Related: this is the same data layer the Shopify Ops Starter builds under your store. Email me for how it’s wired.