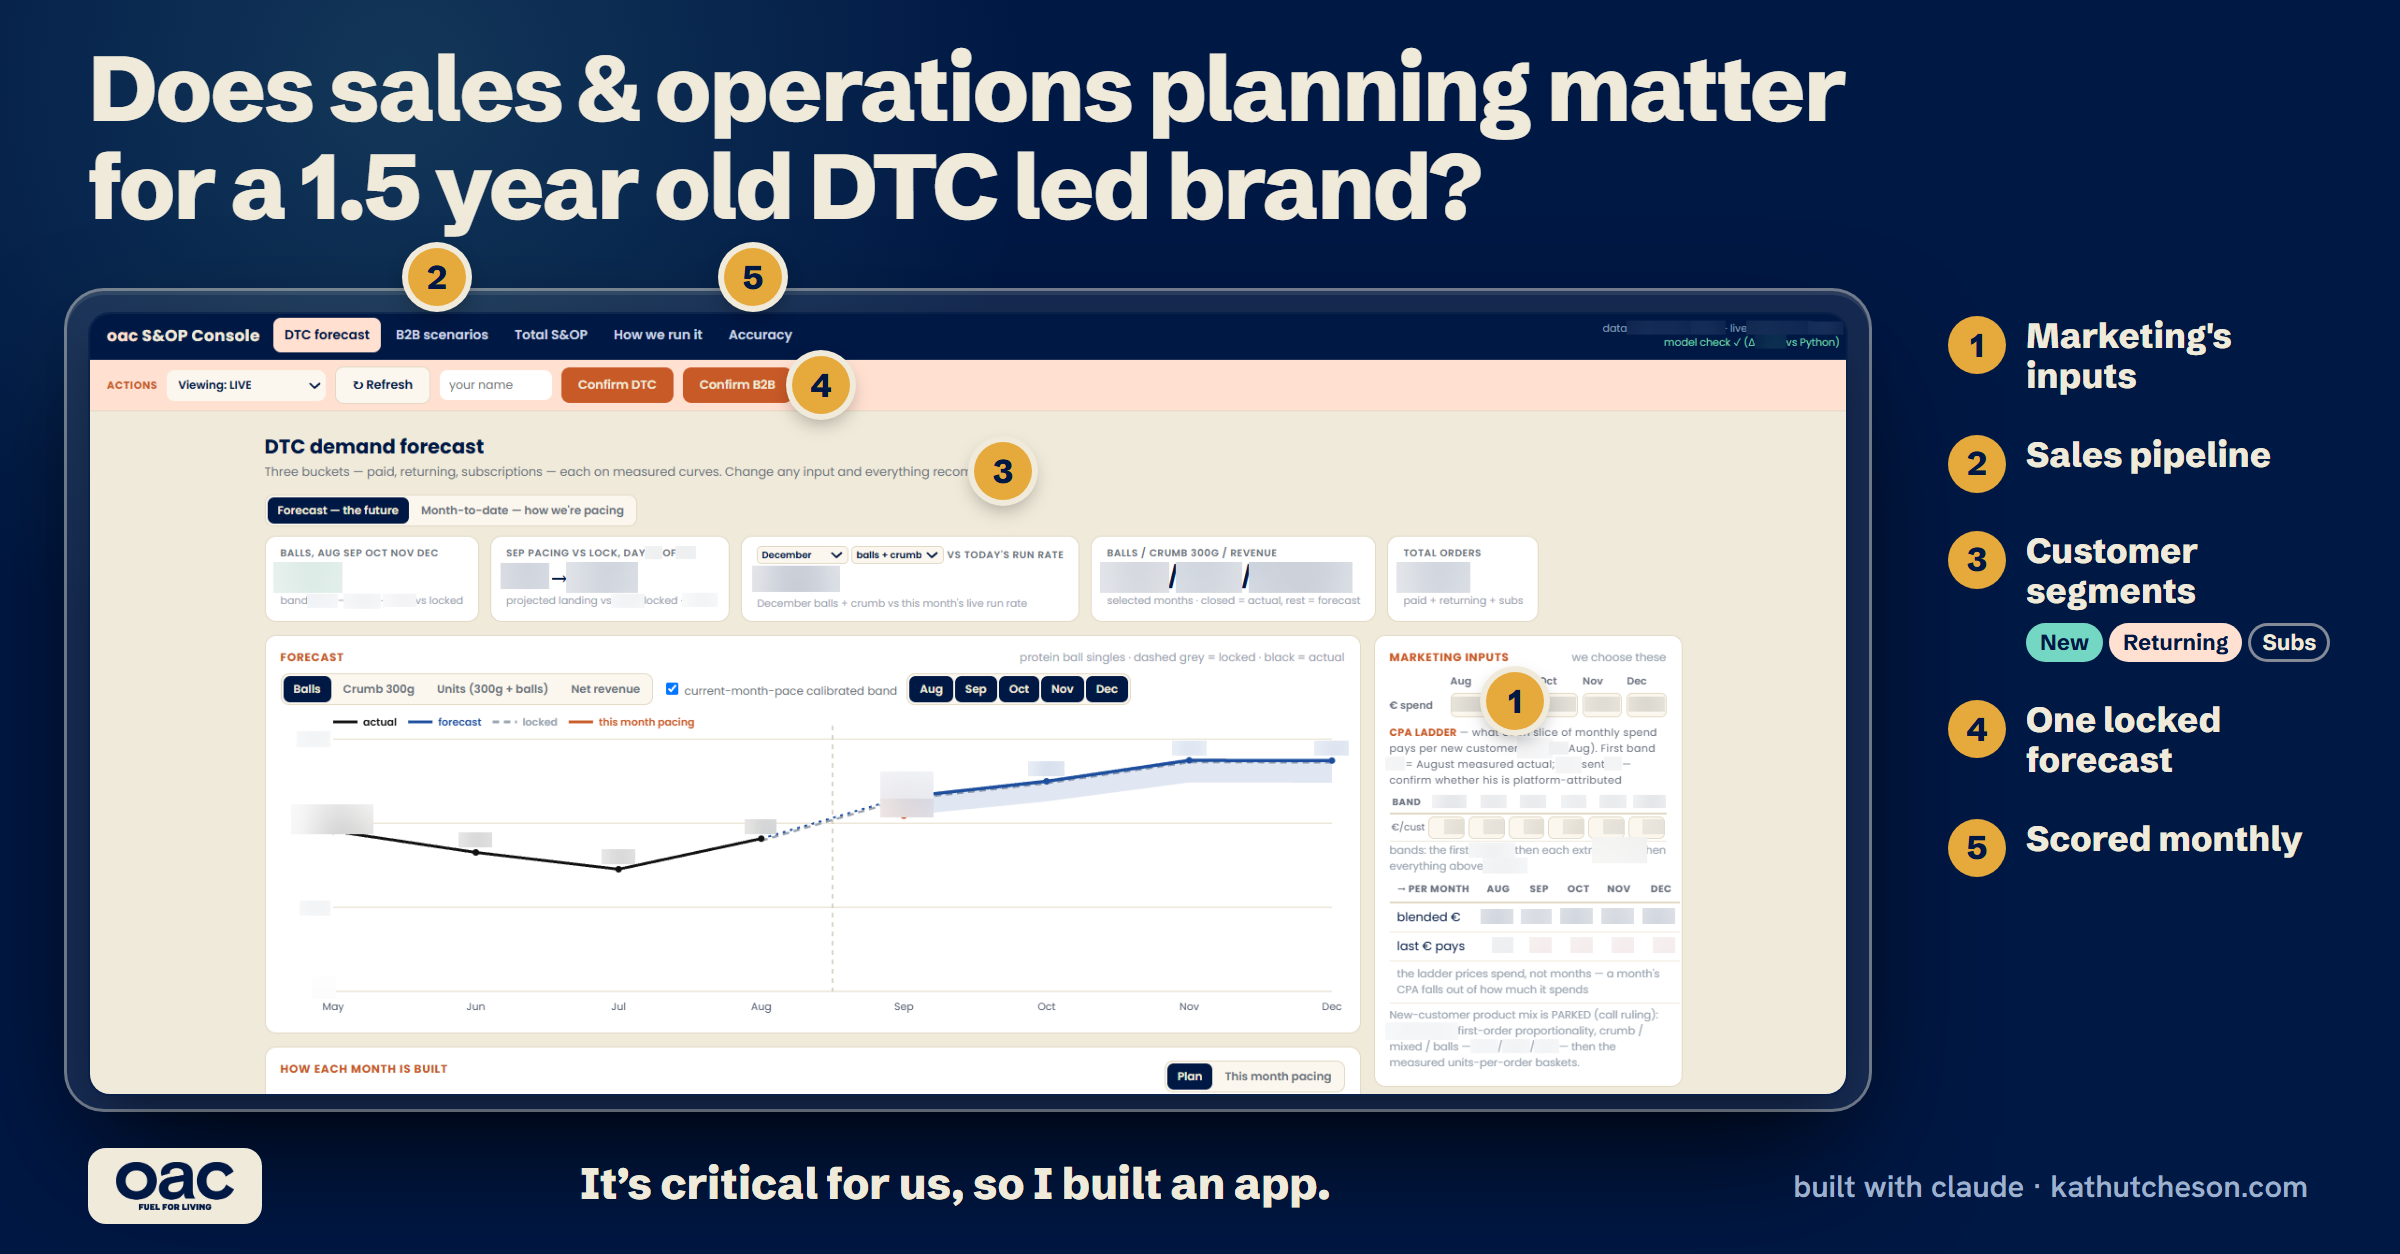
Series: AI x Supply Chain build breakdown
Stack: Claude Code · Apps Script web app · Google Sheets (the oac Brain) · Python for the demand model
Free to use, all of it. Numbers in the screenshot are blurred, the mechanics are not.
Why an 18 month old brand needs this more than a big one does
In a large CPG business, sales and operations planning runs on years of history and a department for every function. We have neither. We are five people, most of us covering a whole function each, working off less than a year of data that describes the business we currently are.
That sounds like an argument for skipping it. I think it is the opposite. A big company can absorb a bad forecast. We cannot. One over-ordered production run is a month of cash sitting in a pallet of stock, and one under-ordered run is a stockout across every channel at once, because we only have one pool of inventory.
Before this, marketing, sales, finance and supply each planned off their own number. Nobody was wrong, and no two numbers matched.
What I actually built
A web app at an internal URL where the team builds, argues about, and locks the demand forecast.
It is an Apps Script web app, which matters for one reason: it runs inside our Google Workspace, reads and writes the Sheets we already keep everything in, and nobody has to log in to anything new. Access is restricted to our domain.
Five pages: DTC, B2B, Total, Info, Accuracy.
The server does three jobs and nothing else:
- Read state. Locks, notes and the change log, read live from the data layer.
- Save an item. A lock or a note gets appended. Every save writes a change log row automatically, so there is no version of events that went unrecorded.
- Reply to a note. Our commercial analyst agent answers questions left in the app, in place, and the reply appears in the thread.
The front end is a single generated HTML file. A Python script compiles the model output into it at build time, so opening the app is instant and costs nothing to run. Refreshing the data means rebuilding and redeploying, which takes about a minute.
The demand model
This is the part worth copying.
DTC demand is built from three buckets that behave completely differently. Forecasting them as one number throws away everything you already know about your own business.
New customers. Planned ad spend divided by what a new customer costs to acquire, split by which product they land on first, multiplied by a measured first basket. This is the bucket marketing controls, so marketing’s inputs go straight in.
Returning customers. Every month we have acquired customers is its own cohort, and each cohort decays on a measured curve. The first several months come from real behaviour on cohorts acquired in a clean, comparable period. Past that, the tail is solved rather than assumed: it is set to whatever value makes the model reproduce the returning orders we are actually seeing in the last 60 days.
Subscriptions. Active subscribers and their cadence, kept separate, because they are the one bucket that does not care what we spend.
On top of that, B2B is a weighted pipeline. Each open deal carries a probability, and our supply agent publishes the trailing B2B baseline with one-off outliers rule-excluded, so the app reads his number instead of recomputing it badly.
Two things I got wrong first
The first version treated every customer we had ever acquired as equally likely to come back. That is a flat rate applied to a base that only grows, which produces a forecast that rises forever. It was wrong in the most dangerous direction, upward.
The second one was subtler and took longer to see. The corrected curve showed a strange revival at ten to eleven months, customers apparently waking up and buying again. I nearly built a story about brand loyalty around it. It turned out to be an artefact of a disrupted stretch early in our own history rather than anything customers were choosing to do. Excluding the affected cohorts, the curve decays cleanly with no revival in it at all.
I only caught that because we keep a log of what was happening to the business each month sitting next to the sales data. Without it, your own operational history goes into the model as though it were customer behaviour, and quietly poisons every forecast after it.
Also in the base: a large group of people who had not bought in over a year, all carrying full weight. On the age curve they are worth close to nothing.
The lock
The team meets, argues, moves the dials, and someone presses confirm. That snapshot is written two ways: the full version with every input that produced it, and a flat month by month mirror that downstream systems read.
A locked forecast is never edited. A change of mind is a new lock. The whole ledger is append-only.
That one rule does more work than the model does. When supply and finance disagree in October about what was agreed in August, the answer takes four seconds to find, and it comes with every assumption behind it. It also means nobody can quietly improve their own number after the fact.
The lock is the handoff. Once confirmed, it stops being an opinion and becomes the input. Supply builds production to it and flags where it disagrees. Finance runs cash off it. Marketing sets weekly targets from it.
Our supply agent receives monthly totals and does the flavour split himself, off recent mix, and flags it when he overrides. The total is fixed. The split inside it is his judgement, because he is the one holding minimum order quantities and lead times.
Scoring, which is the whole point
There is an accuracy page. Every locked forecast gets scored against what actually happened once the month closes.
Error is forecast divided by actual, minus one. A consistent sign means bias, and bias is fixable: some specific input is systematically too high or too low. A sign that flips around is noise, and noise is not fixable, so chasing it burns the cycle. We judge on the month one cycle ahead, because anyone can forecast December wrong.
The benchmark is deliberately humiliating. It is a least squares line through the three closed months before the lock, extended forward. A straight line. If the model, the meeting, the pipeline weighting and the cohort curves cannot beat a straight line, the model is not earning its complexity, and our analyst agent has standing instructions to say so out loud.
We locked our first forecast at the end of August. I do not know yet whether any of it beats the line. Ask me in November.
Want the starter kit?
I will send you the two things this rests on: the S&OP process contract (who owns the forecast, what the lock means, how the handoff into supply works) and the discovery questions below as a fillable worksheet, so you can turn them into your own build brief.
Email me for the kitThe email writes itself, just press send. Or reach me at [email protected].
The questions to answer before you ask Claude to build this
Claude will build you a forecasting app in an afternoon. It will look convincing and it will be useless, because the hard part was never the code. Every question below came out of getting something wrong first.
Answer these before you open a session. If you cannot answer one, that gap is the actual project.
1. What are you forecasting, in what unit?
Units, orders, or revenue? At what product level? If revenue, gross or net, and is tax in or out? We forecast net revenue excluding VAT everywhere, and units at the level production actually runs in. Pick one basis and enforce it on every page, or you will spend every meeting reconciling two versions of the same month instead of deciding anything.
2. How far ahead, and at what grain?
Monthly, six months out, is usually right for a young brand. Weekly is a trap at this size: you will be reacting to noise. Anything past six months is a financing conversation rather than a planning one.
3. What are your demand buckets, and what drives each one?
Write them down before any modelling happens. New from spend, returning from a base that decays, subscriptions from an active count, wholesale from a pipeline. Then name the driver for each: spend divided by acquisition cost, cohorts times a curve, subscribers times cadence, deals times probability. Without this you get one trend line dressed up as a model, and it breaks the first time your channel mix changes.
4. How much of your history is honest?
List everything in your data that will never happen again: stockouts, a production gap, a recipe change, a launch spike, a Black Friday you will not repeat at that discount. Anything that distorted a month needs excluding or flagging. This is the step people skip, and it is the one that turns an operational failure into a permanent fake pattern.
5. Who owns the forecast, and who is allowed to lock it?
One owner, never a committee. Someone has to be accountable for the number being wrong, and someone specific has to press the button. At our size the owner and the person who locks are deliberately different people, which forces one argument before every lock, in the right place.
6. What consumes the number afterwards?
If nothing downstream changes when the forecast changes, do not build any of this. It is only worth the cost of producing if a production plan, a cash projection and a weekly target all move when it moves. Name the three things that will consume it before you start.
7. What is your benchmark, and what would make you abandon the model?
Decide while you are still excited about the project, because you will not be objective later. Ours is a straight line through the last three months, and the rule is written into the process: if the model cannot beat it, the model goes. A model nobody is allowed to kill is a religion.
8. What happens when two people disagree?
Our answer: the app records both positions, one person locks, and the disagreement goes in the change log. Yours can work differently. What it cannot be is unwritten, because the disagreement will happen in your second cycle and whoever is louder will win it.
9. What are you deliberately not modelling?
We do not model competitor activity, weather, or anything we cannot get a number for by Friday. Say out loud what is out of scope so it does not get smuggled back in as a fudge factor.
A starting prompt
Once you have those answers, this gets you a useful first session instead of a generic one:
I want to build a demand forecasting tool for a small consumer brand. Before you write any code, interview me. I will tell you my demand buckets and their drivers, how much clean history I have, what in that history is distorted and why, who owns the forecast, who locks it, and what consumes it downstream. Then tell me what you would build, what you would leave out at my size, and what you think will break first. Argue with me about the model structure before we build anything.
Then go and answer the questions it asks you, rather than letting it assume.
What I would do differently
Build the accuracy page first. I built the model, then the app, then the scoring, and scoring is the only part that tells you whether the other two are worth keeping. Built first, the model would have had to justify itself from cycle one.
I also spent too long making the model elegant before anyone had used it. The lock and the change log took an afternoon and have already changed how the team works. The cohort maths took days and may yet turn out to be worth nothing.
The open question
I still do not know whether the meeting improves the forecast or whether it just makes everyone feel aligned. Those are different things, and only one of them is worth an hour of five people’s time every fortnight.
The scoring will tell me. That is why the scoring exists.
If you run sales and operations planning at any size, I would genuinely like to know: have you ever checked whether your meeting beats a straight line?
Would rather not build it?
I install this kind of thing as a Supply Planning Agent in your own stack: run rates per SKU, one live inventory position, reorder signals with lead times and MOQs built in, and a demand plan that feeds production instead of sitting in a slide.
See how it worksNot open yet. The waitlist gets first pick and founding pricing.